
Just the stats! Revelstoke’s 2016 real estate numbers in review
The 2016 Revelstoke real estate numbers are in the books. Average sale prices increased significantly and the total number of bare lot sales increased dramatically. Here are the 2016 numbers by Mountaineer real estate columnist Emily Beaumont.

There it was, gone. 2016 came and went as fast as many of the homes on the market this year. The buying trend which started early 2015, kept a steady pace throughout the year. While continuing to be fueled by many first-time home buyers, we are now also receiving inquiries from investors, large and small from beyond our great Canadian borders who have gotten wind of our big, little mountain town.
Revelstoke continues to grow, even with the shortage of single family homes on the market, currently just 28, buyers are looking at land / build options. Lot sales skyrocketed totaling 56 in 2016 compared to just 11 in 2015. The building trend will take-off this spring with 38 building permits already approved for 2017.
The City of Revelstoke has taken a giant step forward this week approving a recent application from a local developer for the building of “Laneway Homes” on eight strata lots. Each laneway house will be in addition to the main house, allowing for a detached garage with residential suite above, offering solutions for higher density housing & long-term rental options.
With the increase in property sales over the past two years, again comes an increase in 2017’s Assessed Values. Property owners should have received their 2017 BC Assessment in the mail by now and may find another increase, averaging 8% this year, in addition to last year’s 9.8% increase. If you have questions or have not received your Assessment yet, contact BCA or visit www.evaluebc.com. Although this site offers a wealth of information, keep in mind when considering buying or selling your property, market value and assessed value (or better understood as “taxable value”) are two different things. For further explanation see the past article Assessed vs Market Value.
We live in a very special place there is no doubt. Our #SnowGlobal community is one-of-a-kind and if done right, Revelstoke will continue to offer a lifestyle and outdoor playground the likes the world has never seen.
Here is a breakdown of the type of home sales from January 1 to Dec 31 2016:
- 101 Single Family Residential sales
- 28 Manufactured Home sales
- 8 Strata & Recreation sales
- 56 Lots & Acreages
- For a total of 193 Residential Sales
Number of Single Family Residential sales the past 3 years:
| Month | 2014 | 2015 | 2016 |
| Jan | 7 | 3 | 6 |
| Feb | 1 | 2 | 10 |
| Mar | 7 | 7 | 11 |
| Apr | 10 | 8 | 8 |
| May | 4 | 13 | 10 |
| Jun | 8 | 12 | 10 |
| Jul | 7 | 10 | 7 |
| Aug | 12 | 17 | 14 |
| Sep | 12 | 17 | 10 |
| Oct | 8 | 19 | 7 |
| Nov | 12 | 8 | 7 |
| Dec | 1 | 4 | 1 |
| Annual Total | 89 | 120 | 101 |
Average Sale price of Single Family Homes the past 3 years:
| Average Sale Price | |
| 2014 | $333,230 |
| 2015 | $345,101 |
| 2016 | $376,931 |
Current Listings:
- 13 Commercial
- 85 Residential
- 28 of those are ‘single family’ residential. Many have accepted, conditional offers waiting for subject removal which makes the deal firm and unconditional. They’re not reported sold until the subject conditions are removed.
Time marches on and change remains the only constant. Expect to see more listing on the market as spring approaches. Buying or selling? Give me a call to talk about your options.

What did you think of this story?
Your feedback after we publish a story helps ensure we're always improving our reporting to better serve you
Author

Related Articles

Commercial bear attractant bylaws need update, Bear Aware Society executive director says
Residents ask what the future of commercial wildlife attractant bylaws are following long weekend garbage mix up.
Boaters reminded to keep speeds low near shorelines
Wakes can increase erosion and impact nesting birds, according to Ministry of Water and Lands and Resources Sustainability.
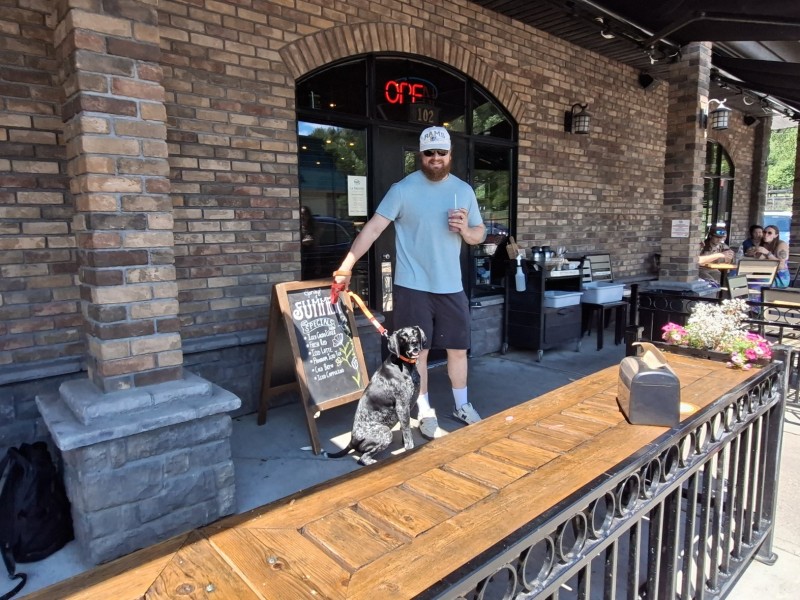
Revelstoke’s dog-friendly patio round-up
Can Fido join you at the table? Or is there a relaxing “dog parking” spot with a fresh bowl of water for them? Here’s where you can and can’t take your dog dining in Revelstoke.