
Just the Stats! Revelstoke real estate statistics from the past quarter
Development lot sales numbers have exploded in Revelstoke in the first six months of 2016. Sales totaled just three in 2015, but have jumped very dramatically to 31 this year.
Learn what’s driving this trend in the latest quarterly real estate statistics report from columnist Emily Beaumont.
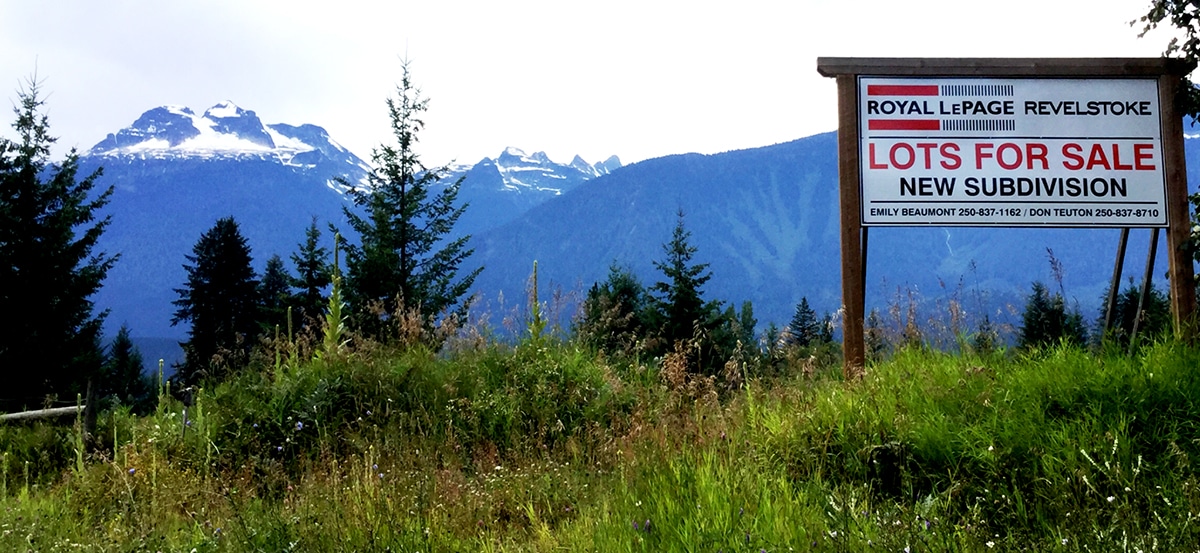
Revy Second Quarter 2016 Stat Update
Real estate sales have kept momentum with 60 single family home and 31 residential lot sales in the first half of 2016. We have a diverse demographic inquiring about living in and investing in Revelstoke. Our B.C. mountain town has something special and people feel it. I still remember my first visit in May, 2006. Something electrified inside me and I knew this was my home. I arrived back permanently 10 months later, the weekend RMR was announced after 20 years of speculation. Timing? Yep, it’s everything.
Life here the past nine years has been monumental, for me and for Revelstoke. I am definitely a better person for having lived here having met some of the most interesting people doing the most interesting things! Even in the regular day to day life. Commuting? Here you can ride your bike! Endless adventure awaits and is limited only by your ambition. All the while remaining connected, if you choose, to the outside world with super fast local and fiber optic internet. Leave the rat race behind and start living the dream.
Lot sales have increased dramatically from just three lots sold Jan-June 2015 to 31 sales this year during the same timeframe. There is an obvious demand for more homes and why not build something custom! There are some great new options in Arrow Heights now available as well.
Let’s hope development and the city work symbiotically to keep Revelstoke a healthy vibrant community, with a wide variety of homes and businesses for all to enjoy in the bright years ahead. Commercial or residential, give our team at Royal LePage a call and find out how we can help you get it done!
Here is a breakdown of the type of home sales from January 1 to June 30 2016 and the totals from the first quarter in 2016 for comparison between quarters:
- 60 Single Family Residential sales, 27 of those in the First Quarter
- 13 Manufactured Home sales, 6 FQ
- 4 Strata sales, 2 FQ
- 31 Lots & Acreages, 5 FQ
- For a total of 108 Residential Sales, 40 FQ.
Number of Single Family Residential sales by Month since 2013:
| Month | 2013 | 2014 | 2015 | 2016 |
| Jan | 4 | 7 | 3 | 6 |
| Feb | 3 | 1 | 2 | 10 |
| Mar | 5 | 7 | 7 | 11 |
| Apr | 5 | 10 | 8 | 8 |
| May | 6 | 4 | 13 | 10 |
| Jun | 6 | 8 | 12 | 10 |
| Jul | 3 | 7 | 10 | |
| Aug | 3 | 12 | 17 | |
| Sep | 12 | 12 | 17 | |
| Oct | 10 | 8 | 19 | |
| Nov | 9 | 12 | 8 | |
| Dec | 5 | 1 | 4 |
Average Sale price of Single Family Homes in the past 3 years:
| 2014 | $333,230 |
| 2015 | $345,101 |
| Jan-Jun 2016 | $364,681 |
Current Listings:
- 122 total listings
- 47 of them Single Family Residential. Many have accepted, conditional offers waiting for subject removal which makes the deal firm and legally binding. They’re not reported sold until the Subject Conditions are removed. Ask about getting on the list to be notified of new listings as they become active!

What did you think of this story?
Your feedback after we publish a story helps ensure we're always improving our reporting to better serve you
Author

Related Articles
Commercial bear attractant bylaws need update, Bear Aware Society executive director says
Residents ask what the future of commercial wildlife attractant bylaws are following long weekend garbage mix up.
Boaters reminded to keep speeds low near shorelines
Wakes can increase erosion and impact nesting birds, according to Ministry of Water and Lands and Resources Sustainability.
Revelstoke’s dog-friendly patio round-up
Can Fido join you at the table? Or is there a relaxing “dog parking” spot with a fresh bowl of water for them? Here’s where you can and can’t take your dog dining in Revelstoke.